Introduction
Shibuya is a load test scheduling tool.
This book will provide two types of guides(Please check the links in the left index):
- People who want to run Shibuya as a service. click here
- People who are using Shibuya. click here
- People who are Shibuya developers.
How to Run Shibuya
In this chapter, we will discuss how you can setup Shibuya as a service, internally or on public cloud, so that you can provide Shibuya as a service to your users.
Let's start with basic requirements.
Setup the dependencies
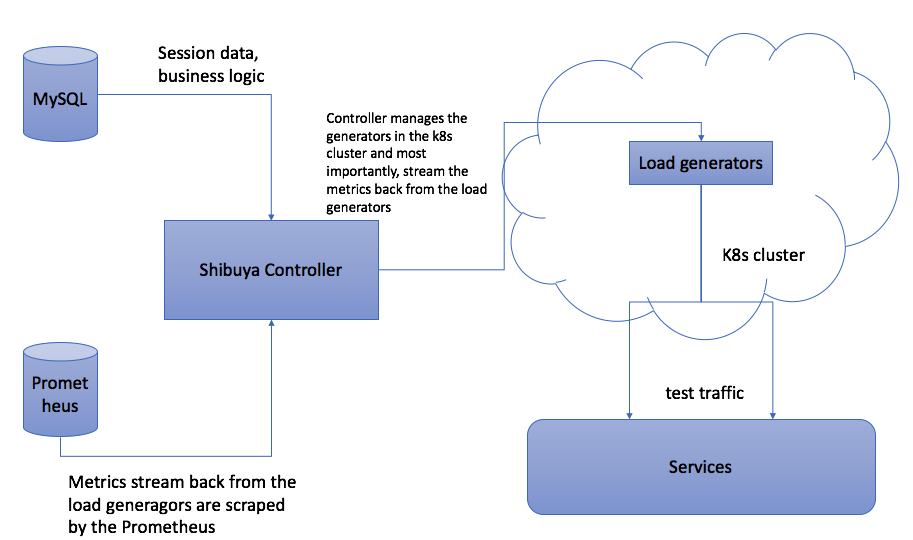
Shibuya relies on below components:
- shibuya-controller: The actual process that handles all the Shibuya business logic
- Kubernetes: Shibuya deploys all the load generators into a kubernetes cluster
- MySQL: all the session data and business logic
- Grafana: Metrics collected by Prometheus will be rendered at Grafana
- Prometheus: Metrics collected from the load generators will be scraped by Prom.
We will discuss each of this dependencies separately.
Architecture Overview
Shibuya-controller
We don't limit how you deploy the shibuya controller. The process it self is running inside a Docker container and is listening on 8080 port. In this page, we will explain how you can build your own shibuya controller. Moreover, Each shibuya controller is configured by a configuration file called config.json. The details can be read here.
Kubernetes
Current supported versions should work well with Shibuya.
Please follow below steps to setup the k8s cluster:
kubect create ns shibuya-executors
Load generators
Jmeter
Currently Jmeter is the only engine Shibuya supports. (We need to provide a public Jmeter image)
Object Storage
We use object storage to store all the test plans and their related files, for example, csv files. Currently we support two types of storage:
- HTTP REST based API object storage(Nexus)
- GCP bucket.
Please go to here to see the detail guide.
MySQL
Internally, we are using fork of MySQL, MariaDB. But current versions of MySQL should work well with Shibuya.
All the schema files are stored under db folder. You just need to load the schemas into the database.
Grafana
Prometheus
Authentication model and multi tenancy
Basic
Currently, Shibuya supports LDAP based authentication and no authentication. No authentication is mostly used by Shibuya developers.
Please bear in mind, a more robust authentication is still WIP. It's not recommended to run Shibuya in a public network.
If you choose to disable authentication, that also disables multi tenancy. All the resources will be belong to a hardcoded user name shibuya.
LDAP authentication
When user logs in, all the credentials will be checked against a configured LDAP server. Once it's validated, the mailing list of this user will be stored and later used as ownership source. In other words, all the resources created by the user belong to the mailing lists users are in.
All the LDAP related configurations will be explained at this chaper.
Dockerfile
Shibuya controller runs inside a Docker container. In order to sucessfully build a Docker image for your own controller, you will need these files:
- kubeconfig
- GCP config JSON (only if you are using GCP)
- Config file for shibuya controller itself.
kubeconfig and shibuya controller config
COPY config/kube_configs /root/.kube
COPY config_${env}.json /config.json
For kubeconfig, as you can see in the Dockerfile , you only need to provide the kubeconfigs here: shibuya/shibuya/config/kube_configs.
For the shibuya config file, you will need to put it here shibuya/shibuya, which is the building context of this Dockerfile. ${env} here is the building argument. If your k8s cluster is gcp_tokyo, you can name your config file as config_gcp_tokyo and build the Docker image as follows:
docker build -t ${image_name} --build-arg env=gcp_tokyo .
GCP config
ADD ./shibuya-gcp.json /auth/shibuya-gcp.json
You will need to add the gcp auth file to the build context, which you can learn here: https://cloud.google.com/docs/authentication/getting-started
Configuration Explanation
Below is a sample configuration of Shibuya. We will explain them by sections.
{
    "bg_color": "#fff",
    "project_home": "",
    "upload_file_help": "",
    "auth_config": {
        "admin_users": [],
        "ldap_server": "",
        "ldap_port": "",
        "system_user": "",
        "system_password": "",
        "base_dn": "",
        "no_auth": true
    },
    "http_config": {
        "proxy": ""
    },
    "db": {
        "host": "db",
        "user": "root",
        "password": "root",
        "database": "shibuya"
    },
    "executors": {
        "cluster": {
            "on_demand": false
        },
        "in_cluster": true,
        "namespace": "shibuya-executors",
        "jmeter": {
            "image": "shibuya:jmeter",
            "cpu": "1",
            "mem": "512Mi"
        },
        "pull_secret": "",
        "pull_policy": "IfNotPresent"
    },
    "dashboard": {
        "url": "http://localhost:3000",
        "run_dashboard": "/d/RXY8nM1mk2/shibuya",
        "engine_dashboard": "/d/9EH6xqTZz/shibuya-engine-health"
    },
    "object_storage": {
        "provider": "local",
        "url": "http://storage:8080",
        "user": "",
        "password": ""
    },
    "log_format": {
        "json": false
    }
}
General Configs
    "bg_color": "#fff",  # UI bg colour. Could be useful when you are using Shibuya in multiple networking environments.
    "project_home": "",
    "upload_file_help": "", # Document link for uploading the file
Auth related
All authentication related logic is configured by this block
    "auth_config": {
        "admin_users": [], # admin mailing list. A admin will have a dedicated page to view all the running collections
        "ldap_server": "",
        "ldap_port": "",
        "system_user": "", # ldap system user
        "system_password": "", # ldap system pwd
        "base_dn": "",
        "no_auth": true # Turn off auth completely
    }
HTTP client
Once this is configured, all the traffic will pass through proxy. Including metrics streaming and requests to k8s cluster.
    "http_config": {
        "proxy": ""
    }
DB configurations
    "db": {
        "host": "db",
        "user": "root",
        "password": "root",
        "database": "shibuya"
    }
Executor configurations
Shibuya supports two types of clusters:
- on demand, specifically, GKE in Google Cloud Platform.
- on-premise cluster.
With on demand mode, Shibuya is able to automatically create nodes and clean resources after usage. In most cases, the GKE cluster used by Shibuya has 0 worker nodes(to save money).
Shibuya controller can be run outside of a k8s cluster, which usually is the cluster where the generators are deployed. If this is the case, in_cluster should be set to false, true for otherwise.
    "executors": {
        "cluster": {
            "on_demand": false
        },
        "in_cluster": true,
        "namespace": "shibuya-executors", # this is the namespace where generators are deployed
        "jmeter": {
            "image": "shibuya:jmeter",
            "cpu": "1", # resoures(requests) for the generator pod in a k8s cluster.
            "mem": "512Mi"
        },
        "pull_secret": "",
        "pull_policy": "IfNotPresent"
    }
Metrics dashboard
Shibuya uses external Grafana dashboard to visualise the metrics.
    "dashboard": {
        "url": "http://localhost:3000", # root of the dashboard url
        "run_dashboard": "/d/RXY8nM1mk2/shibuya", # link to the metrics of all the runs.
        "engine_dashboard": "/d/9EH6xqTZz/shibuya-engine-health" # link to the health of the engines.
    }
Object storage
Shibuya uses object storage to store all the test plans. It supports two types storage:
- HTTP based storage service, like, Nexus.
- GCP bucket.
    "object_storage": {
        "provider": "local", # either gcp, local, or Nexus
        "url": "http://storage:8080",
        "user": "", # HTTP basic authentication user and password
        "password": ""
    },
Please bear in mind, local should be only used by Shibuya developers.
Logging support
    "log_format": {
        "json": false
    }
If you require logs to be in JSON format, you can set json: true.
GCP
TODO
Object Storage
In Shibuya, we support two types of object storage:
- Nexus(REST based)
- GCP bucket
Nexus
Nexus provides a REST API for resource CRUD. HTTP Basic authentication is used. If the storage solution you are using is following the same API spec, it will also work. Specifically:
| HTTP method | Resource operation |
|---|---|
| GET | Get the resource |
| PUT | Upload the resource |
| DELETE | DELETE the resource |
All these method require HTTP basic authentication.
GCP
How to use Shibuya
Basic Concepts
Shibuya developers
If we split the work of Shibuya into two big categories, these are the two:
- Frontend(UI). They are mainly based on Boostrap and Vue.js.
- Backend(API, controller, shibuya-agent). All of them are written in Go.
Backend
API
Shibuya follows RESTful API standard. They can be found in shibuya/api/main.go
Controller
This is where the core Shibuya functionality is. Below is the core functionaties of the controller:
- Engines lifecycle management with the scheduler, Kubernetes is the only scheduler we are supporting. Lifecycle management includes launch/purge/healthcheck the engines.
- Trigger engines and stop the tests engines. This will essentially start and stop the tests.
- Stream the metrics generated by the engines, such as latency, thread number. and expose them as Prometheus metrics.
Most of the above logic can be found in shibuya/controller/engine.go
Engine is an abstraction name of load generator. Shibuya is designed to supported multiple load generators since day 1. Currently, the only load generator we are supporting is Apache Jmeter.
Metrics streaming
Controller reads all the metrics from engines in Server Side Events. The content of the events can be customised as you would need to write your own parser to parse the metrics and expose them via Prometheus. For example, you can check the current Jmeter logic at shibuya/controller/jmeter.go
Since the controller is reading the events from the engine, the server side implementation also needs to be taken care of. We will discuss this part in the shibuya-agent.
shibuya-agent
shibuya-agent is a process running alongside with load generator in order to work with controller. The main responsibility of the agent is:
- Take the HTTP requests from controller. Such as start the test, stop the test, healthcheck requests, etc
- Forward the metrics generated by load generator back to the controller via SSE. The metrics have to be text based in order for streaming.
For current Jmeter implementation, you can check here shibuya/engines/jmeter/shibuya-agent.go